
What is the internet status of the City of Seattle?
By Dylan Dang
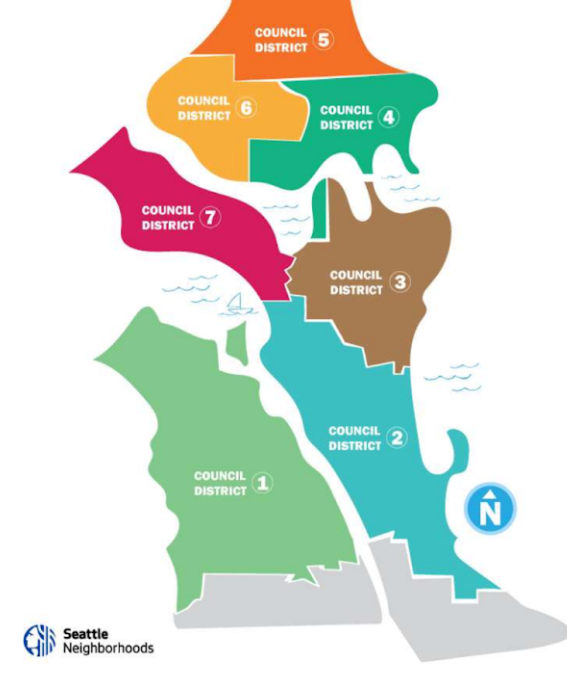
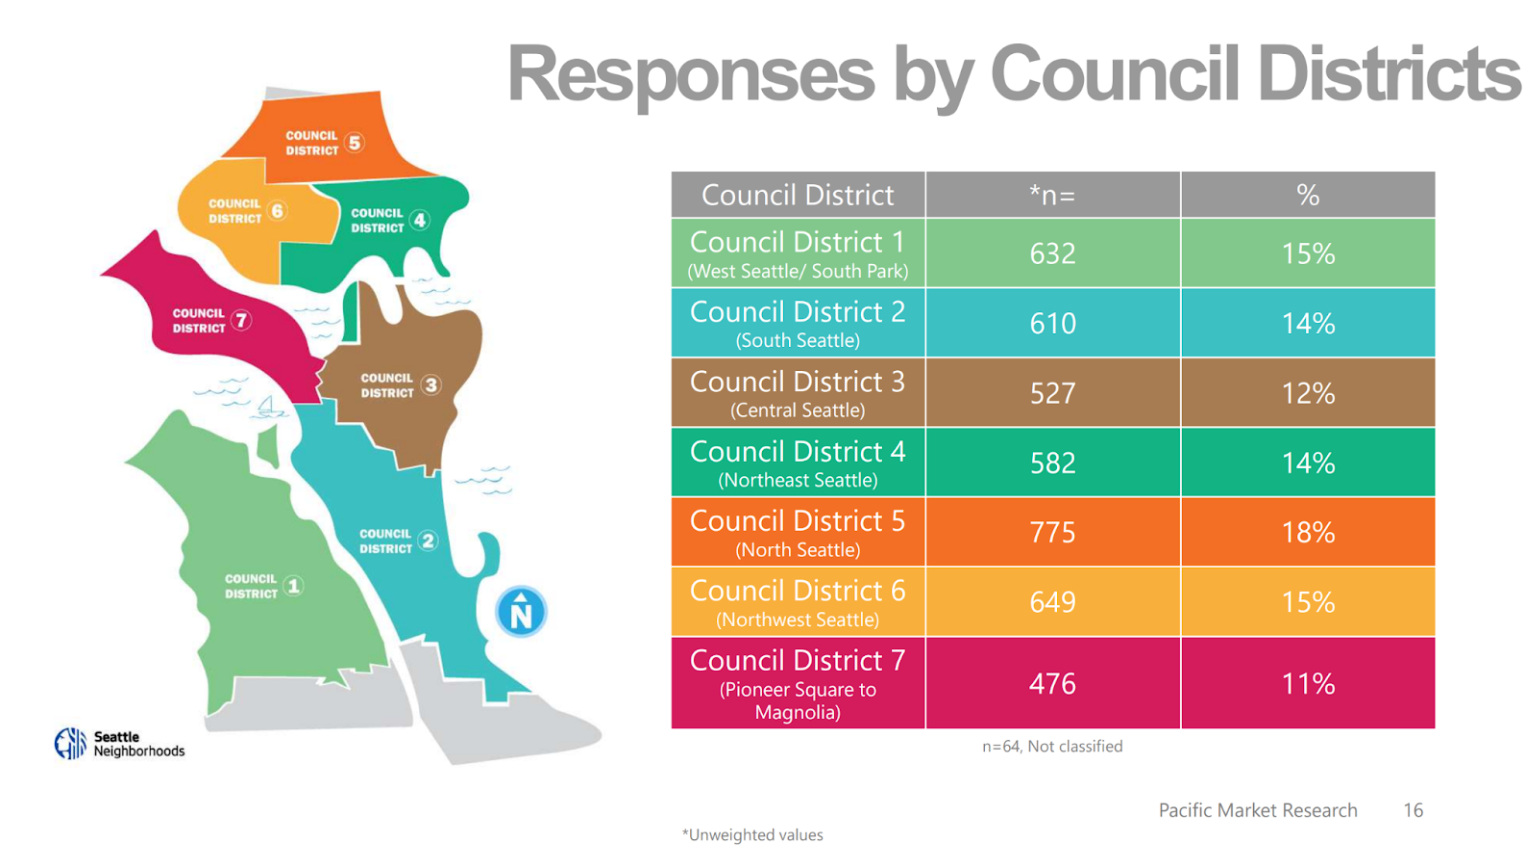
In this age getting online is important and even here in the well-connected City of Seattle there are residents that have a difficult time getting adequate internet access. An important step that we must take to improve digital equity in the city is to identify “coldspots” for digital access. In this way, resources can be directed to meet the areas and populations of highest need. In 2018, the City of Seattle’s Information Technology (IT) department contracted a study of access in the city. The Seattle IT Connectedness Segmentation Study Full Technical Report is the most recent survey of residents connectedness needs and is being used to plan the city’s digital equity strategy. Below are a few interesting facts I pulled from the 214 page report. Much of the report centers on differences of access between Seattle’s 7 Council Districts as well as by household income and size.
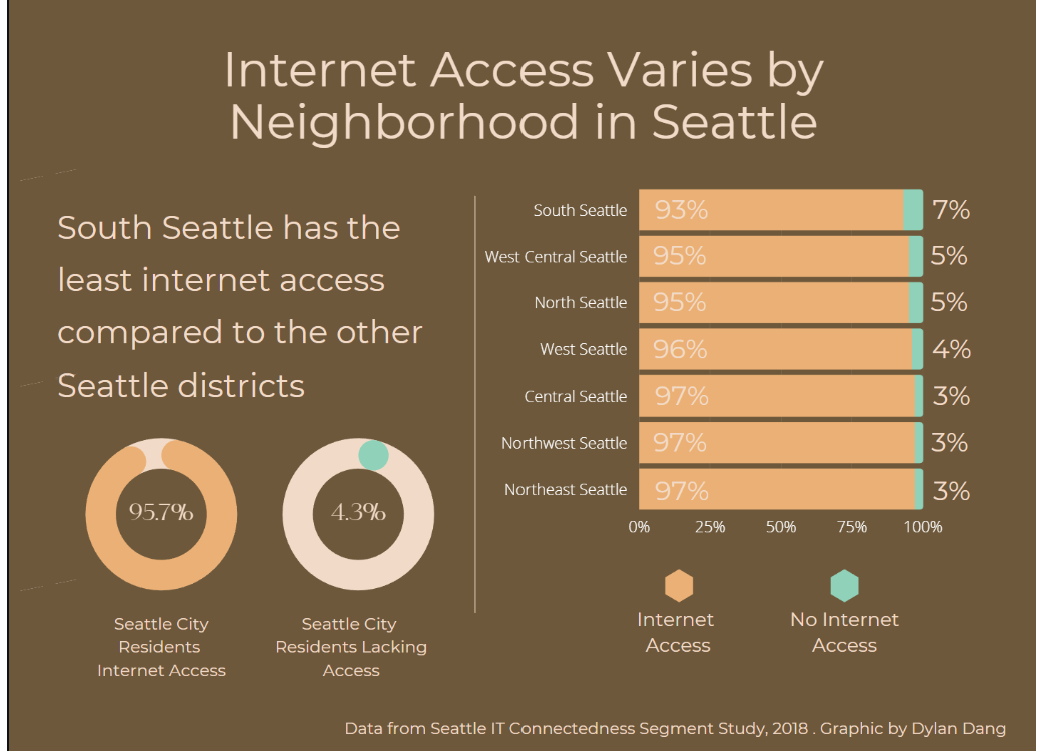
Internet Access Varies Across the City
Of Seattle’s seven council districts, lack of internet ranges from 3% to 7%. South Seattle has lower rates of internet access than the other council districts at 7% of residents lacking access.
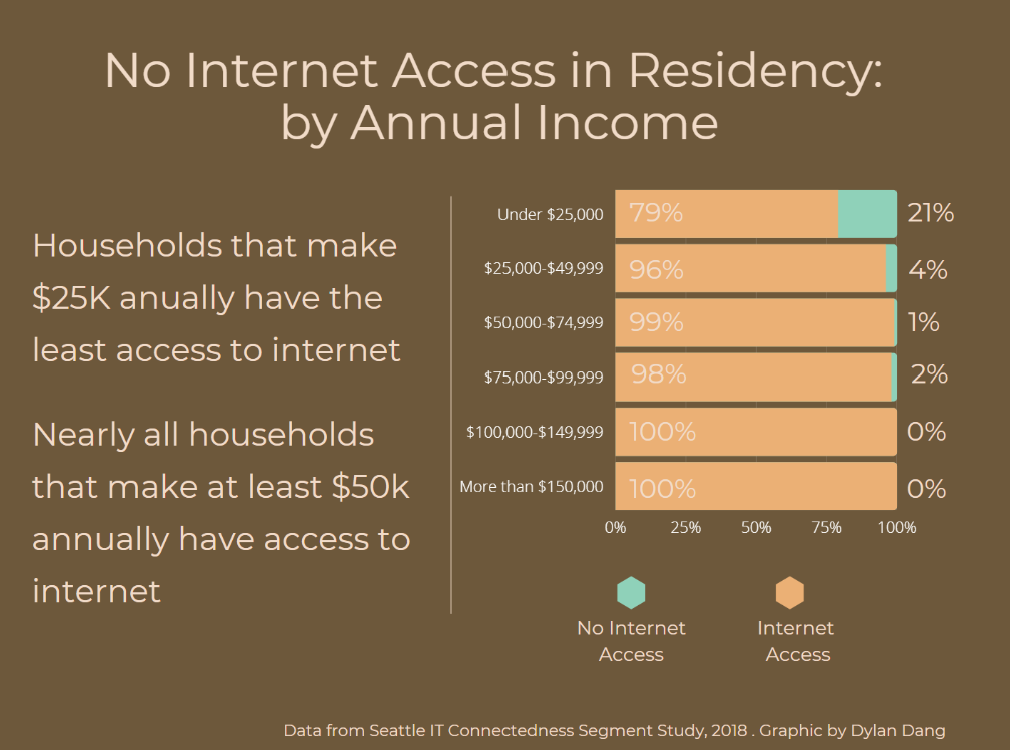
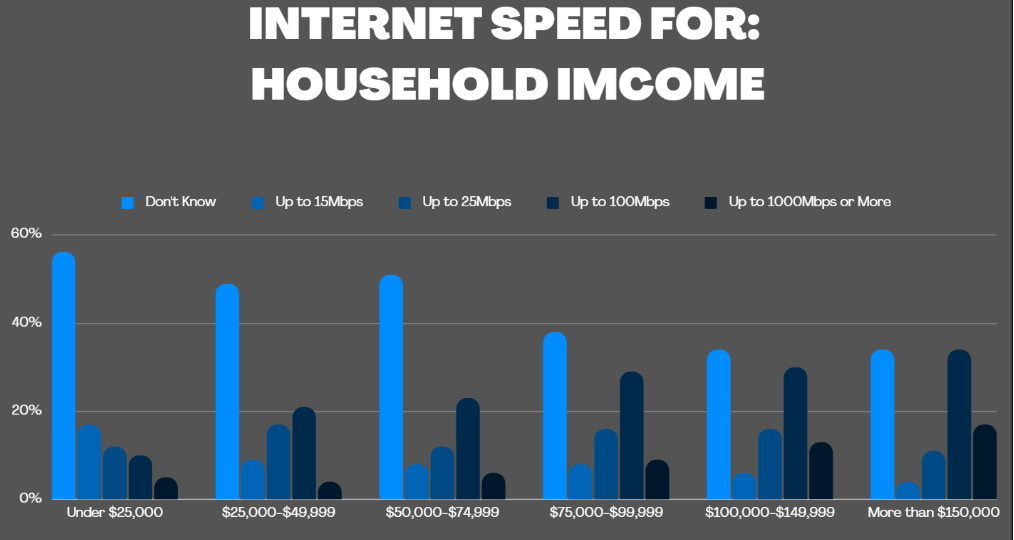
Households with an annual income under $25,000 are far less likely to have internet access
According to the report, an astonishing 21% of households making under $25,000 a year lack internet access. This compares to 4% for households making up to $25,000 to $49,999; 1% for those making $50,000 to $74,999; 2% for $75,000 to $100,000. All households making more than $100,000 reported having internet access. This suggests that the internet is essential but unaffordable for low-income households.
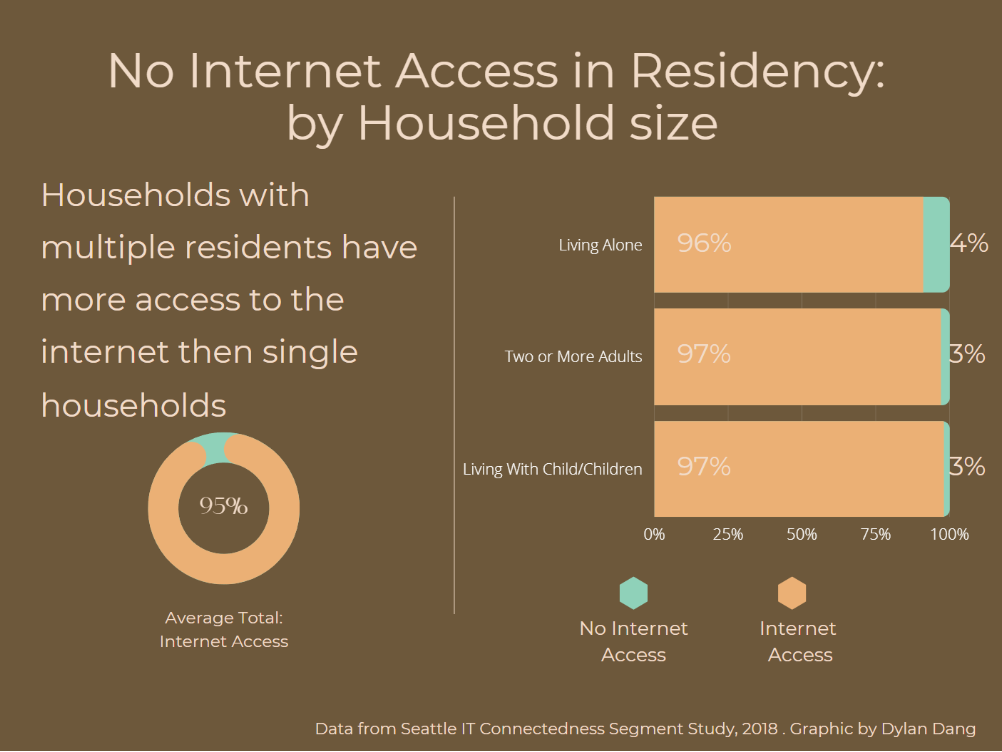
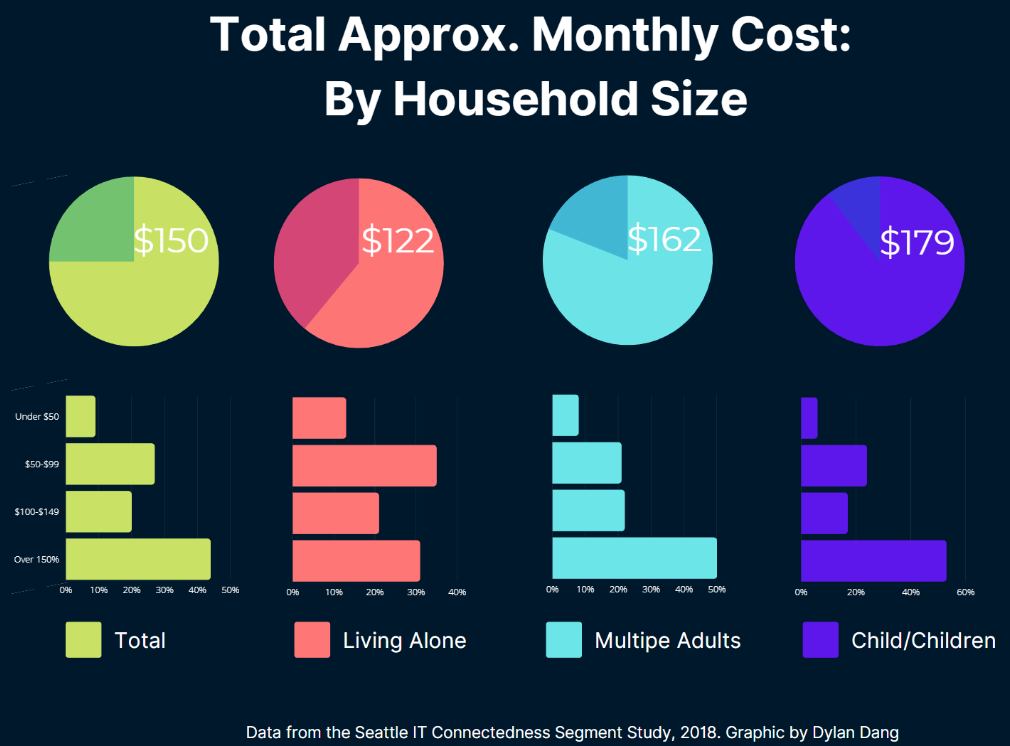
Internet access varies among the size of households.
Households with children and two or more adults have been reported to have more internet access than adults living alone.
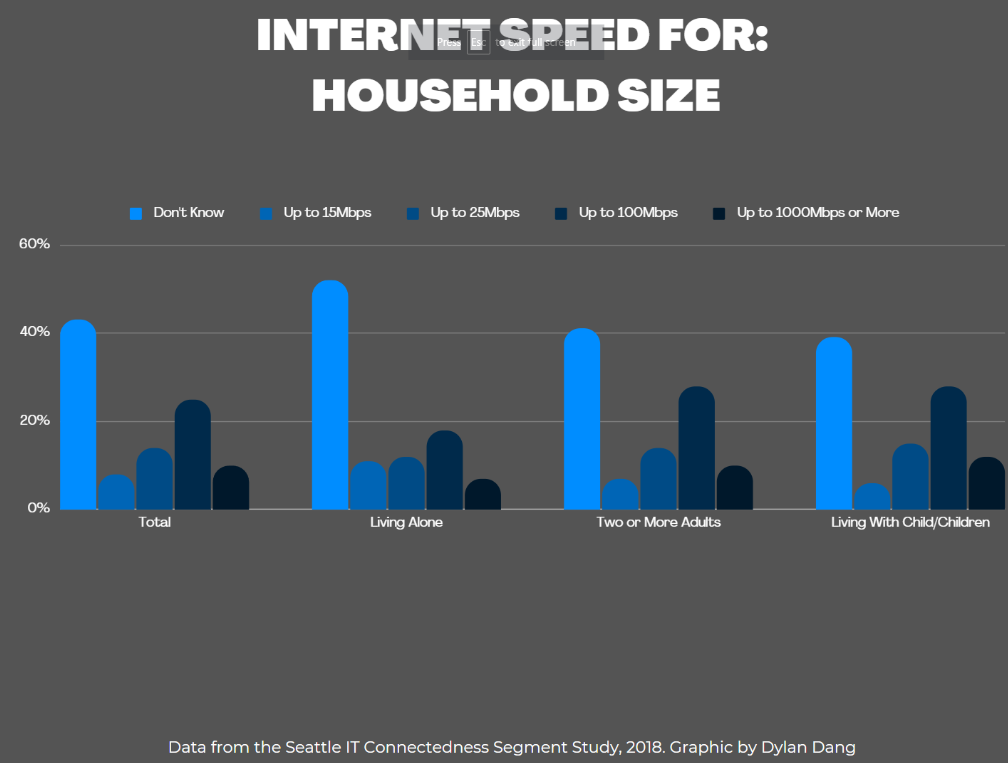
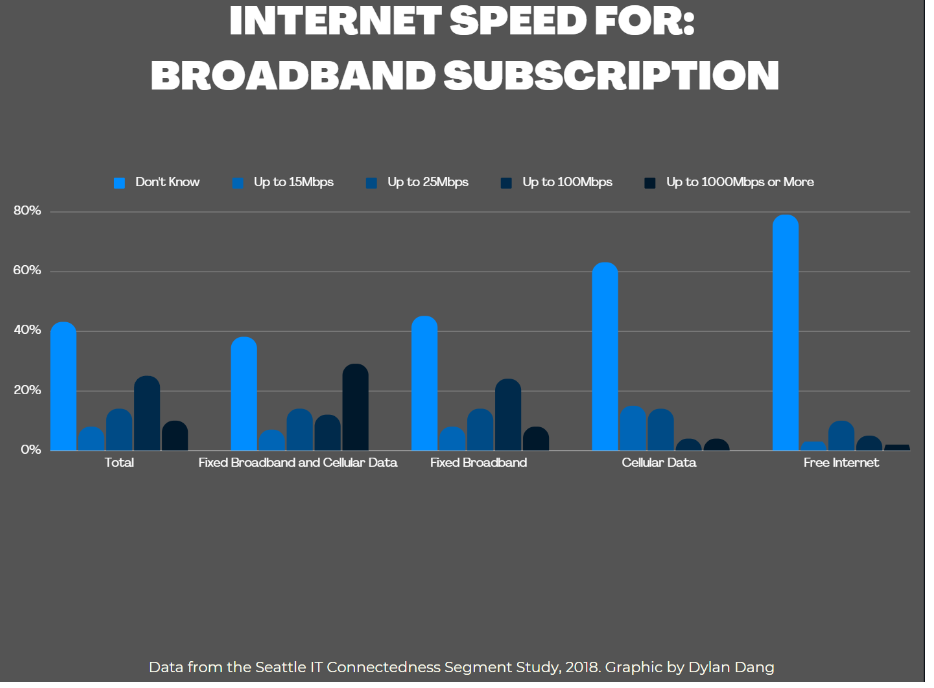
Seattle Residents Don’t Know Their Broadband Speed
Boardband speed does matter, especially for work and school. For broadband speed, anything up to 100 Mbps (megabits per second) for download speed is considered fast and anything lower is considered slow. Households with children are more likely to know their speeds to keep the kids happy, than households without children. Residents who paid for a more expensive internet plan are more likely to know their broadband speed than those who pay less to nothing. For the types of paid broadband subscription such as fixed broadband and cellular data, there are more residents that know their boardband speed compared to free internet users. Majority of the free internet users may have no knowledge of what their broadband speed is. This data seems insufficient since many residents do not know their internet speed, however this data shows how not knowing is part of the equity problem. Not knowing your internet speed means that internet providers can take advantage of that and you could be paying more money for a slower connection. According to the website Broadband Search, the US has one of the most expensive internet costs but is only decent in terms of speed. To learn more and become aware of your internet access you can take this free online speed test that will tell you the internet speed in your home.
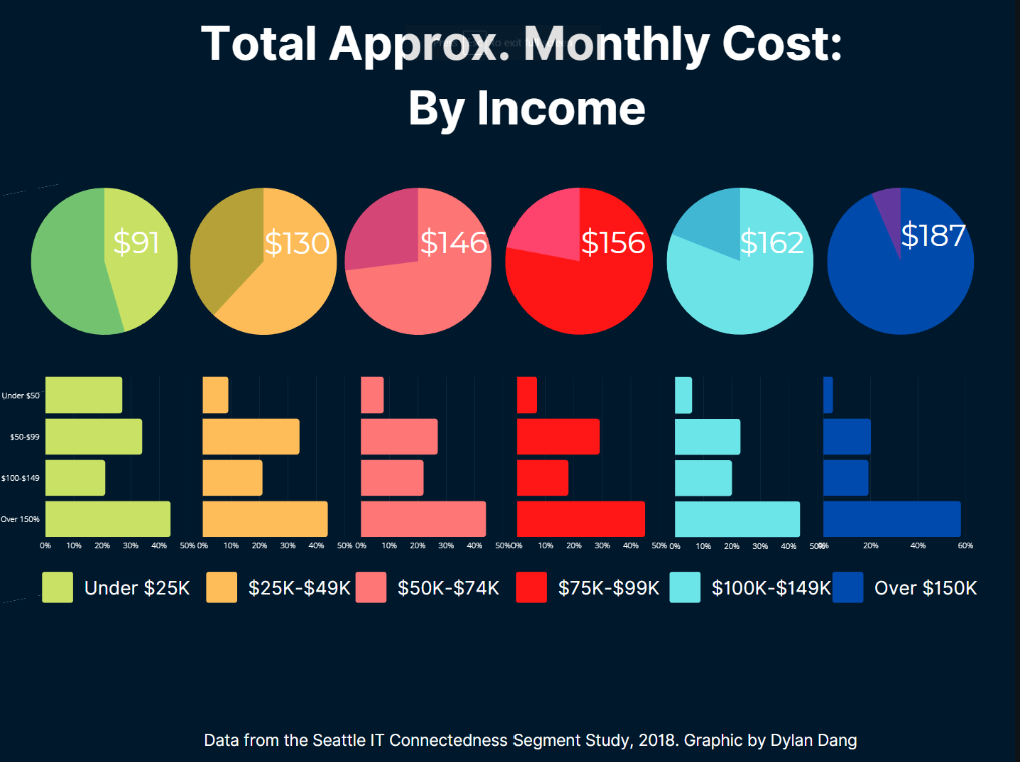
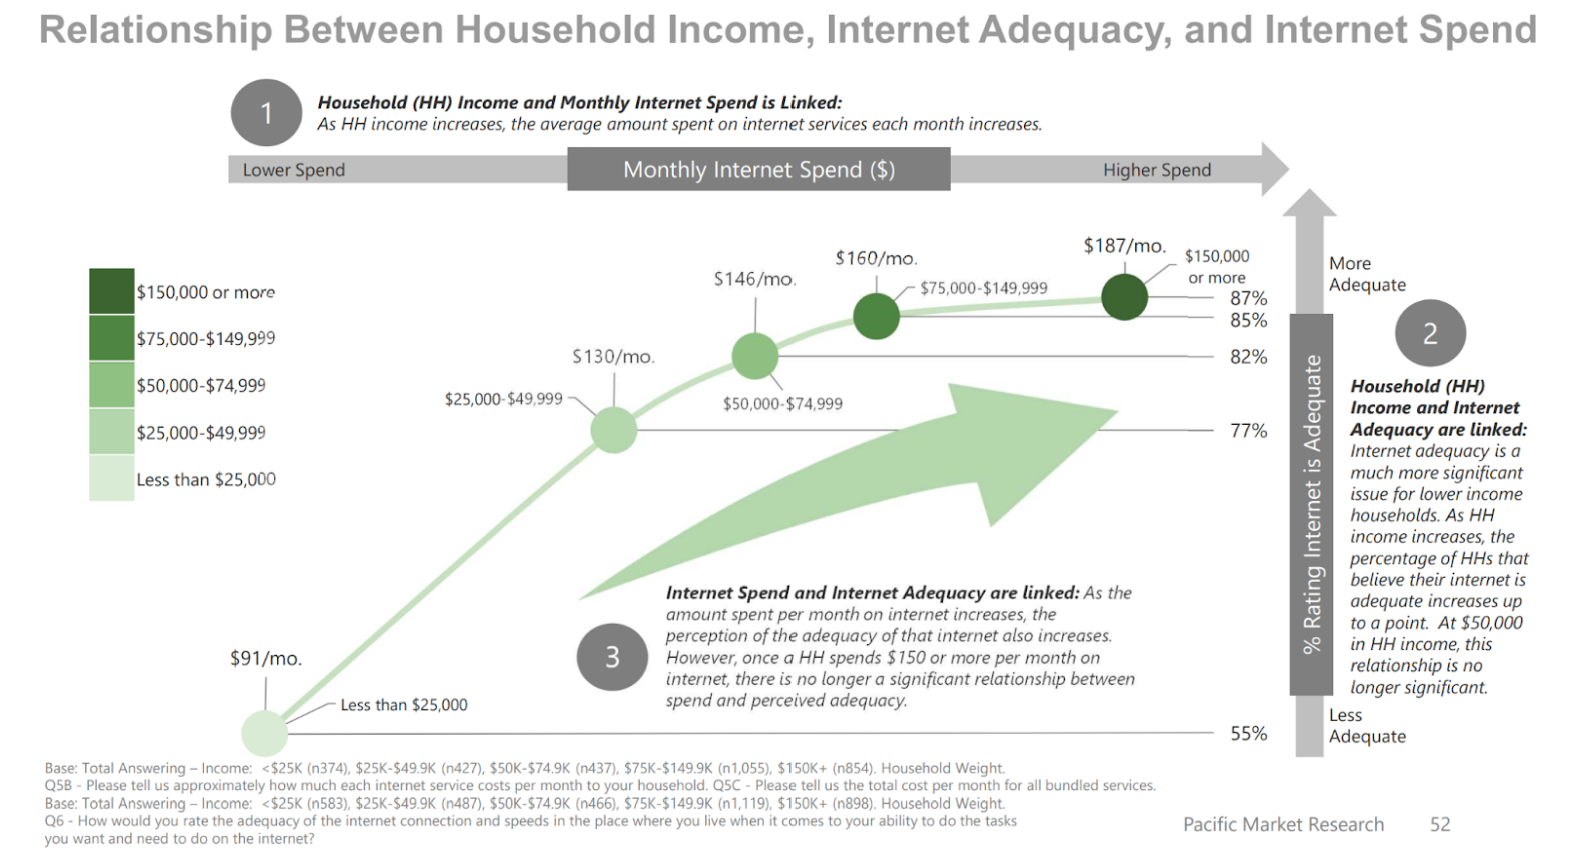
Affordability rather than need drives how much we pay for internet.
There is a correlation with household income and monthly internet payment. Households with a higher income will spend more on internet. According to the Seattle IT report, Seattle residents spend on average $150 on internet per month. West Seattle spends the most money at $168 per month on internet whereas Central Seattle spends the least with $137 per month. Households with one adult spend significantly less on internet than households with multiple adults and households with children. This data may suggest that households that have more need for increased bandwidth spend more. However, analysis in the report shows variation on average monthly payments across the city which also suggests that income drives how much is spent on internet rather than the needed bandwidth.
Sources:
https://www.broadbandsearch.net/blog/internet-costs-compared-worldwide